Scaling instruments in Moto
I’m creating a Kinect experience called Moto at the moment (you’ve probably heard me banging on about it somewhere) where you get to play air instruments for realsies. There’s guitars and drum kits superimposed on the screen it’s magical:
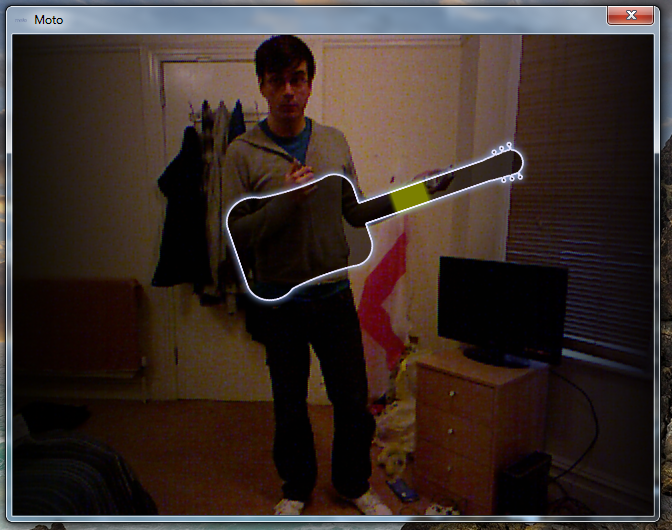
But how do you make it follow the player? That bit’s pretty simple. On every frame you just map the dimensions of the image to the appropriate point on the player using MapSkeletonPointToColor(). It’s all just Cartesian co-ordinates – X and Y. The real complicated thing is when you get the Z-axis involved. Not exactly used to that.
The method I used to get scaling to work is all but technical. Really. I stuck my hands in the air and took pictures of them.
The room I develop in is pretty small – it’s about 3m between the Kinect’s position and the door. Using my Limb Position Snapshot Github tool (Yeah, it’s on Github, go check that out) I was able to pinpoint 1, 2 and 3 metres away from my Kinect and marked them on the floor with post-it notes. More scientific methods of measurements are available I’m sure.
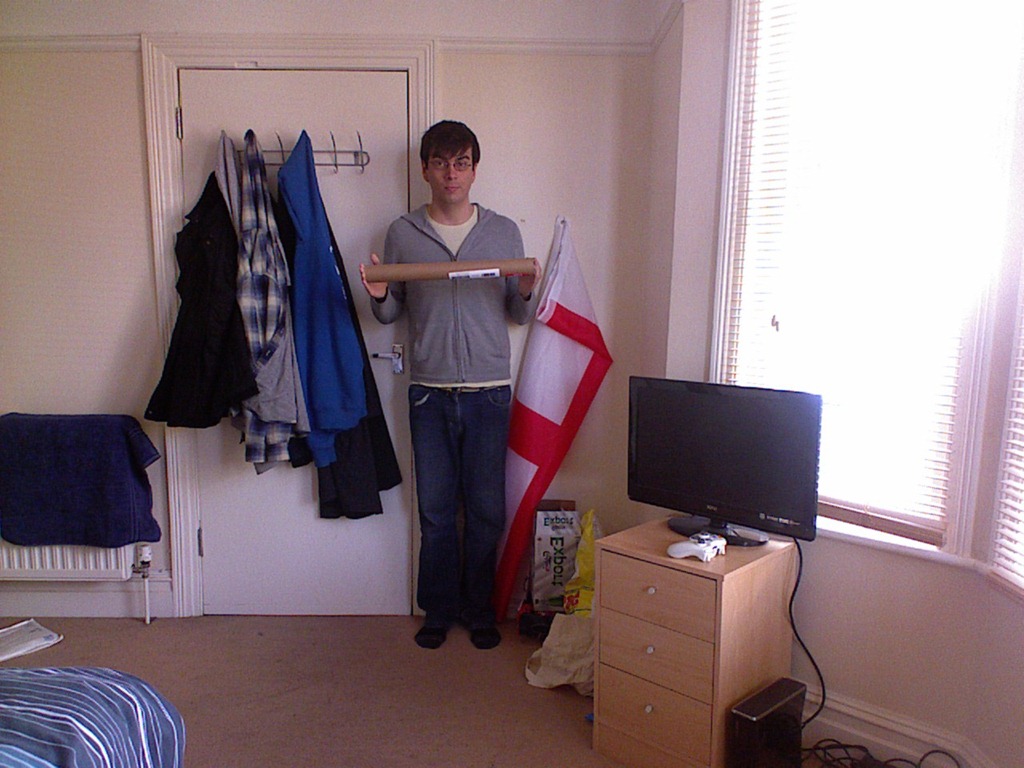
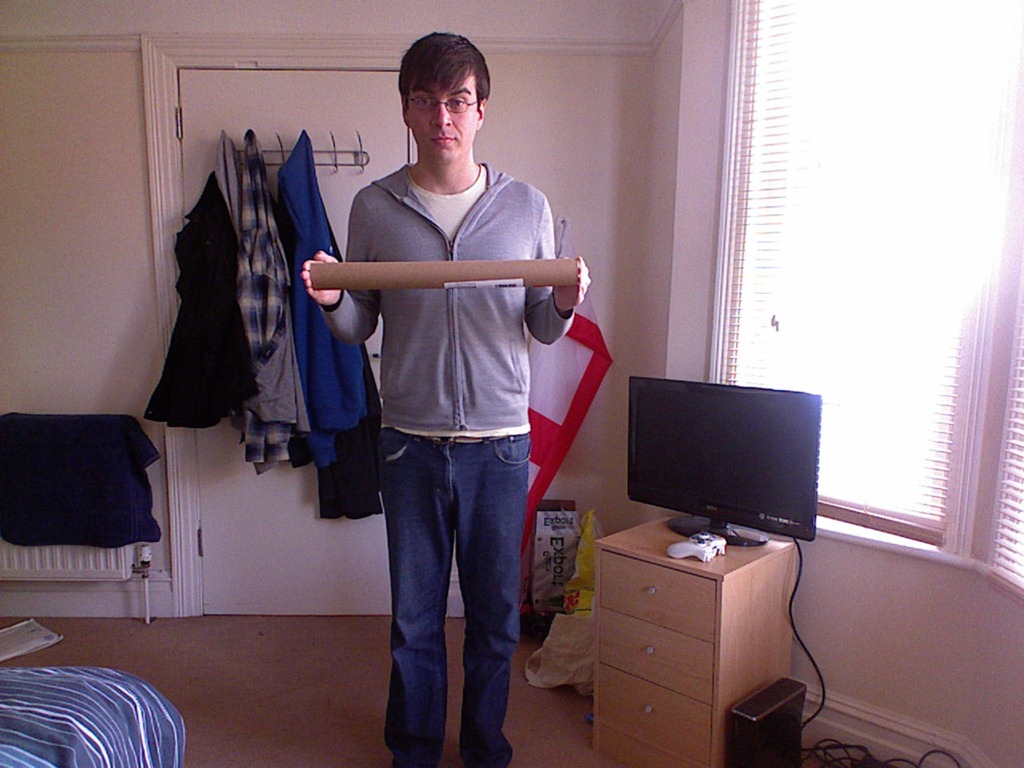
Then I stuck my hands out at the width of whatever instrument I was measuring. I knew the neck of the guitar was about 70cm, the drum kit is about a metre wide etc. The images above are the original images for the Wall of Sound before I made it a bit bigger.
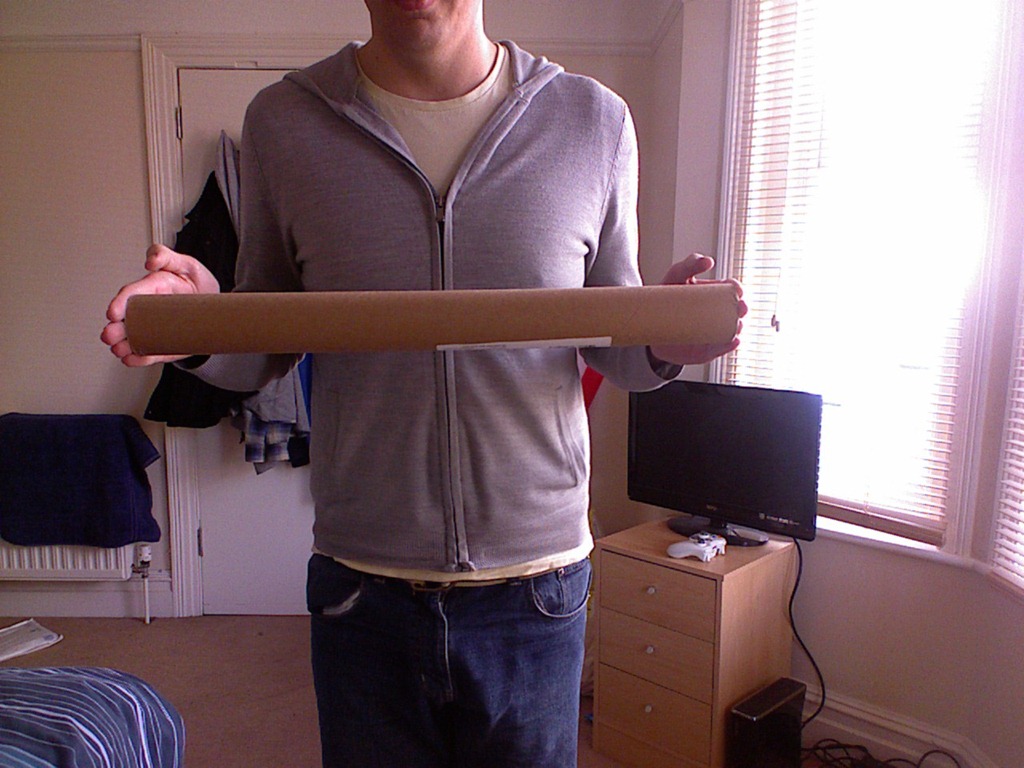
Seeing as that poster tube was a fixed width every time I took the picture, I can measure the width in pixels it will be on screen at 3, 2 and 1 metre away.
![]()
Then you just chuck it into Excel and make a graph out of it.
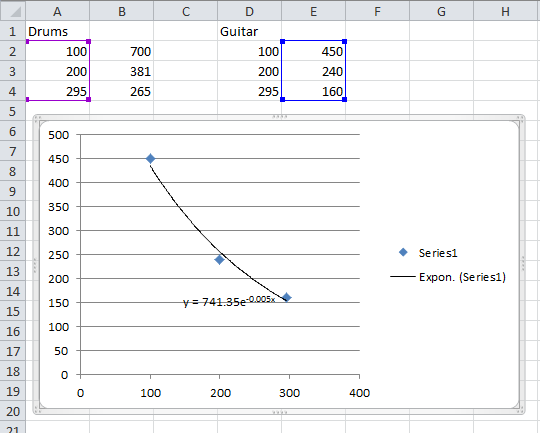
As your Maths teacher drilled into you in school the more points you can get the more accurate your graph will be, but because I’m stupid I used only 3 points.
Inputting the distances in centimetres (metres is a better idea, as Kinect sees Z in metres) alongside the width in pixels and going to Insert –> Scatter Graph you get this lovely graph. Right click a point and going to ‘Format Trendline’ brings this box up. Click ‘Exponential’ on the trend type and the ‘Display Equation on chart’ checkbox and close.
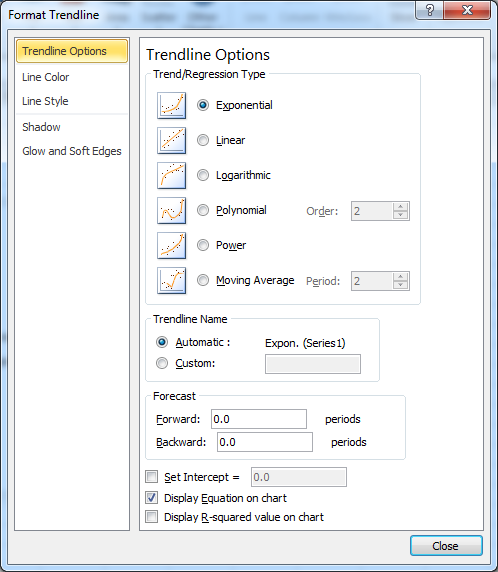
That’s what gives you that funky ‘y =’ number on the graph. Copy that, jump into whatever is aligning the graphic and change it into some meaningful value. I created a function for mine so I could reuse it in different places, making a separate equation for each width.
private double scaledWidth(MainWindow.Player player)
{
	//y = 696.24e-0.007x

	//Player distance (Converted to centimetres)
	double distance = player.skeleton.Position.Z * 100;

	double width = 1112.5 * Math.Pow(Math.E, -0.006 * distance);

	return width;
}
So given the player’s Z position as X in the function it spits out a width for the function. In WPF supply a FrameworkObject a width or a height and it will scale it proportionally. Instant scaling. Sorted.